Using Grafana to Explore WEKA Metrics
Reviewing Preset Dashboards
To check for a metric not covered in your existing dashboards:
Open Cluster Info, or
Navigate to Dashboards → WEKA Presets
Example: Availability Dashboard
Select the customer (e.g.,
N/A)Select the cluster (e.g.,
dev cluster)Review available metrics within the dashboard panels
Retrieving Metric Stat Names
On Pending IOs / IOs Per Interval Open a panel’s menu (three dots) on the top right
Go to Inspect
Select Data
Select JSON tab
The expr field contains the PromQL (Prometheus Query Language)
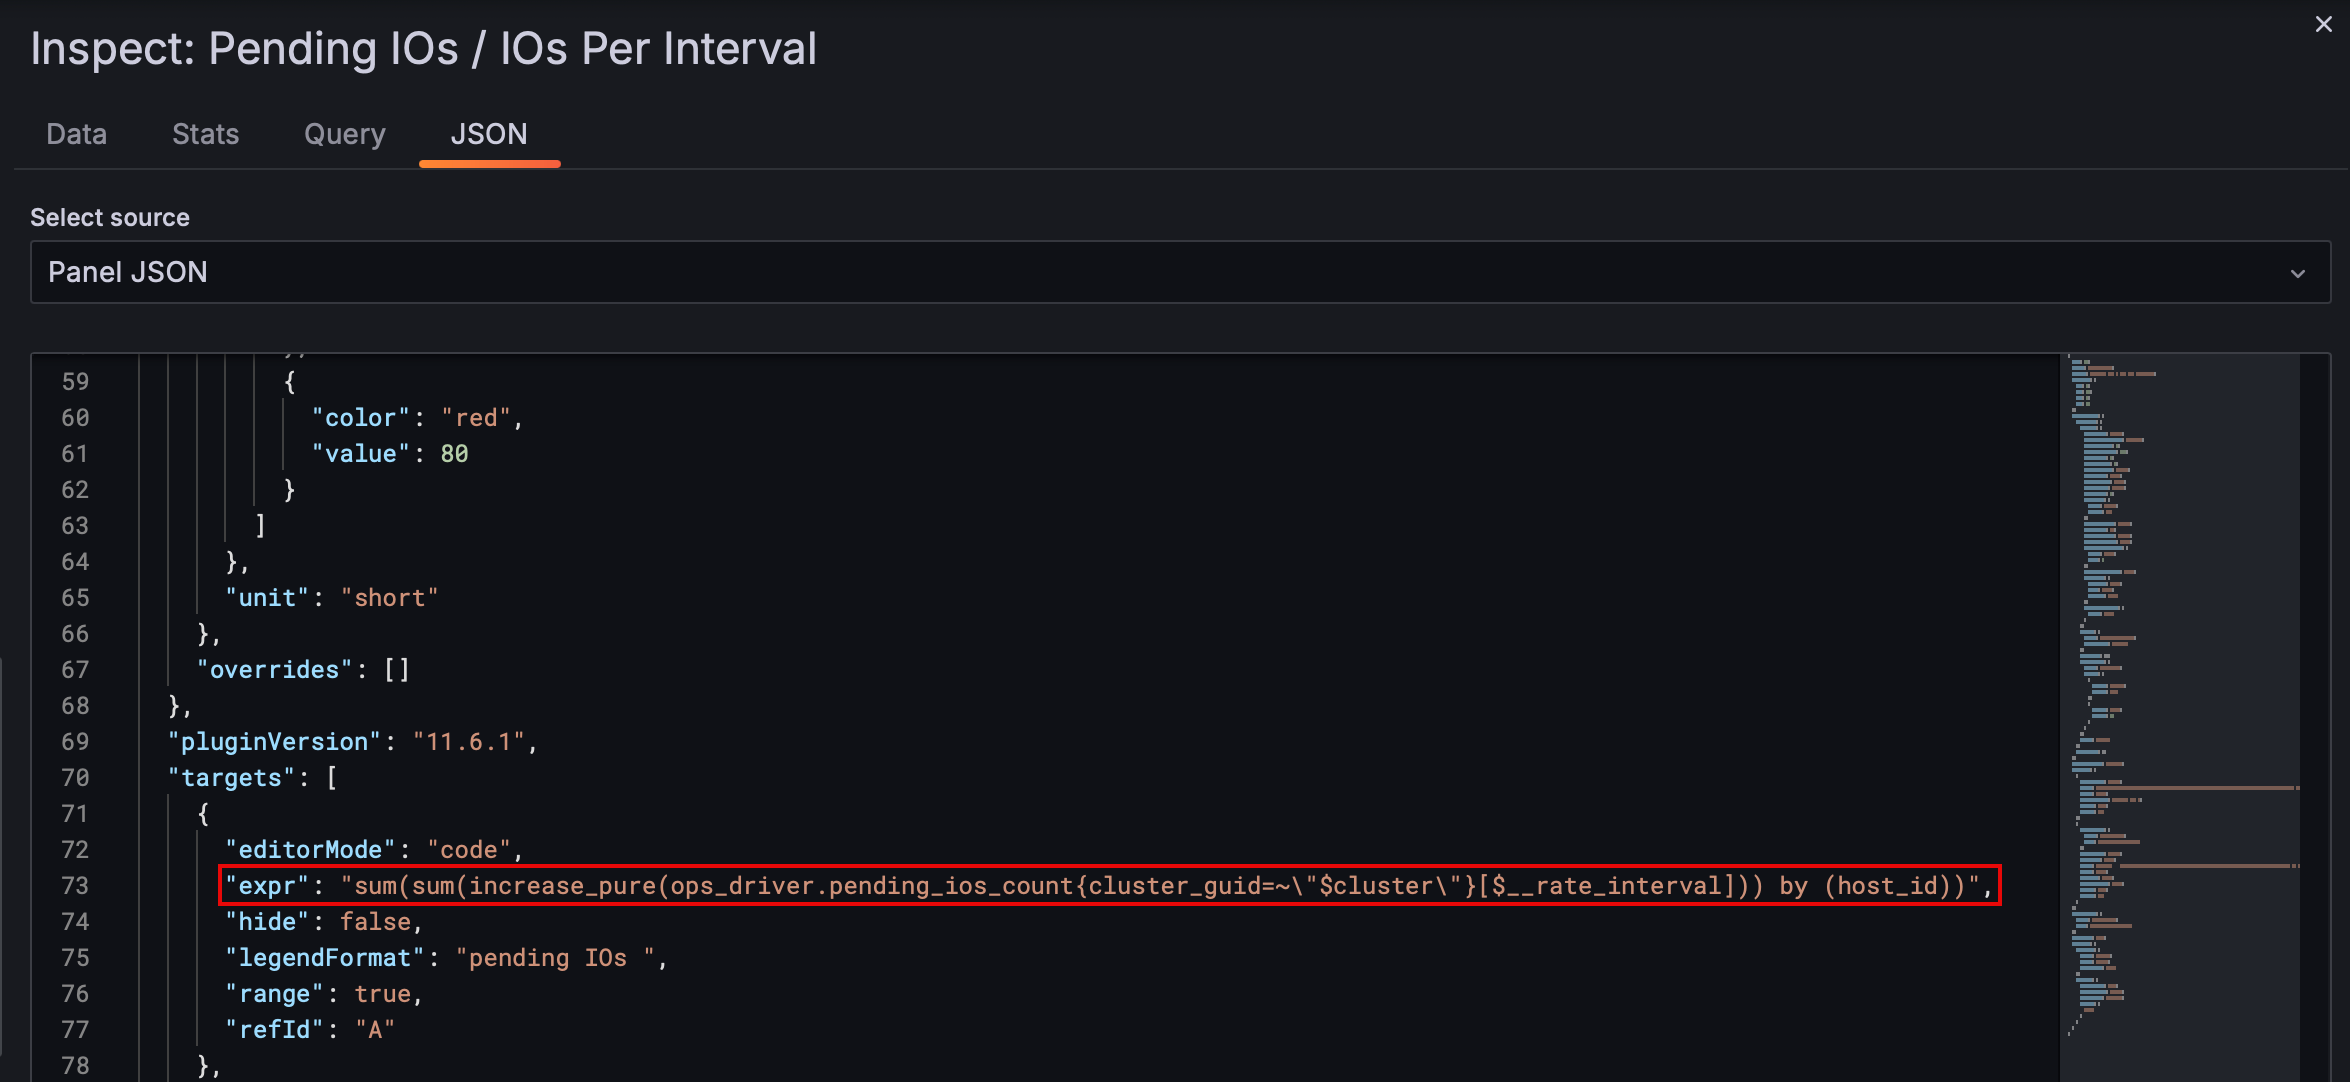
This query indicates the metric name
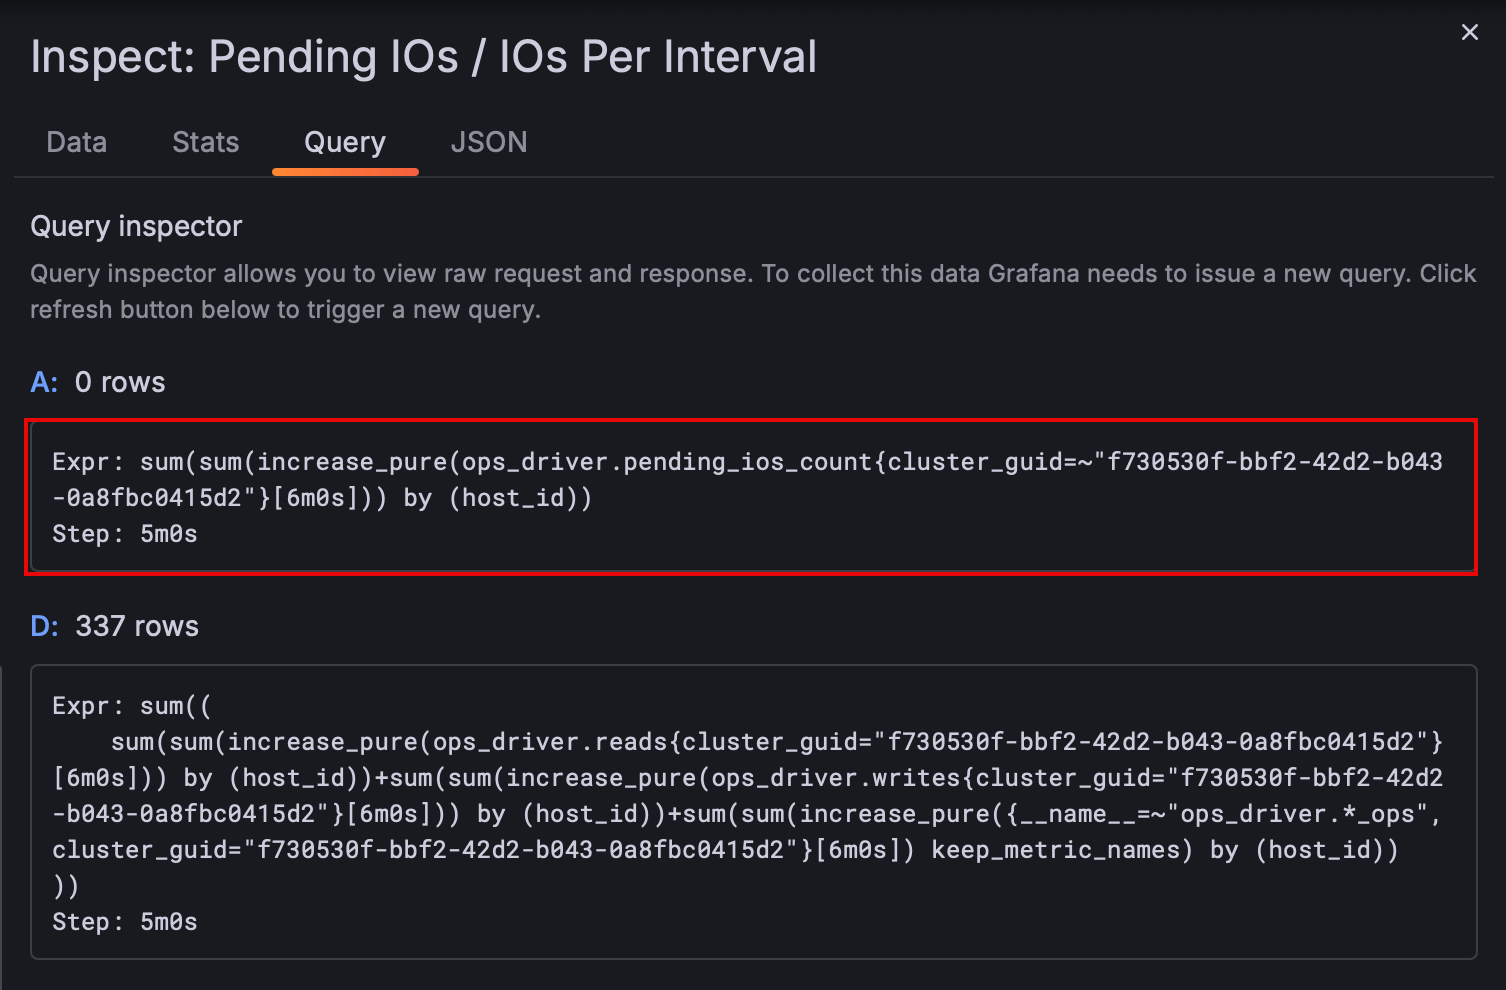
You can also use the Query tab to see the expression
NO EXPLORE AVAILABLE
Only users with an editor or administrator role, or a specific data sources explore role, have access to Explore by default
Exploring Custom Metrics
Accessing the Explore Pane
Open Explore, ensure the data source is set to Victoria Metrics, and enter the name of the metric of interest—for example, ops_driver.read_bytes. Labels such as cluster_guid can be applied to narrow the results to a specific cluster or component.
Both the graph and the raw data points can be analyzed directly. For instance, querying fs_stats.write_bytes displays the per-node write activity. If this counter does not change over time, it indicates that no write operations occurred on that node during the observed period
Go to Explore from the Grafana sidebar
Choose the data source — typically:
Victoria MetricsThis contains all cluster metrics
Query Methods
Two input modes are available:
GUI Builder (assists with query construction)
Code Editor (raw PromQL)
Example Query: ops_driver_read_bytes
Apply filters using available labels:
Common labels:
cluster_guid,hostname,node_id, etc.
Filter by
cluster_guidto narrow to a specific clusterThe generated PromQL query is shown in the builder
Time range defaults to “last 1 hour” but can be adjusted
Run the query to see results
Interpreting Results
Two result formats:
Graph View — plots time series
Raw Data — shows labels and values per time series
Example result:
Node:
261Metric:
read bytes(unit: bytes)Flat value over time indicates no reads occurred
Metric type: counter
In this example, 17 time series are returned, indicating 17 nodes
The graph can be toggled between line, dot, or bar view (default: line)
Working with Multiple Queries
Multiple queries can be added in the Explore pane
Example:
Add a second metric query (e.g.,
write bytes)Results will show multiple values (e.g., Value A, Value B)
Each value can be renamed for clarity
You can hide specific queries to focus on others
Notes
Grafana may limit displayed series (e.g., “Only showing 20 series”) if too many are returned
This can happen when querying metrics with high cardinality